
Asset Planning & Decision Optimisation…Demystified (Part 2)
In my last post, the first in this two-parter, we started discussing some of the questions many of you are facing as your assets age: how do you decide which assets get priority attention? And how do you compare different asset investment strategies, and figure out which combination will deliver the highest value over the planning horizon?
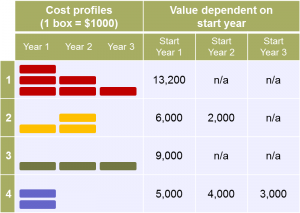
We started considering the case of a fictitious client who has a mere $3,000 per year budget and a portfolio of four investments—each with its own cost and time constraints. The goal is to find the set of investments that deliver the highest value. Easy right? Not so much as it turns out.
Rank by Value and Cutoff
The simplest prioritisation method is to rank projects by value, until you use up year 1 resources. In this case, investment #1 has the highest value at $13,200, followed by #3, #2, #4. However, investment #1 also uses up the entire budget in year 1, so that’s the cutoff. The total value of the selected portfolio is therefore $13,200.
Rank by Value and Time Shift
Investment candidates #2 and #4 can be shifted into future years to “fill” the leftover capacity, but moving those investments to future years affects the value.
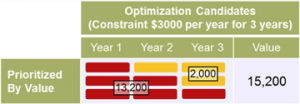
For example, the value of investment #2 decreases to $2k when it begins in year 2. However, if we shift investment #2 to year 2, we could undertake investments #1 and #2, use up our entire budget, and end up with a value of $15,200, as shown here. Similarly, if we shift investment #4 to year 3, we end up with a value of $16,200.
Rank by Value/Cost
Another commonly used ranking method is value/cost or, in layman’s terms: ”bang for the buck”. Here, investment #3 would rank highest ($9k value divided by $3k cost = 3) followed by investment #4 ($5k/$2k = 2.5), then #1, and #2.
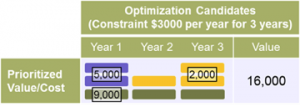
A simple rank and cutoff analysis would have us select investments #3 and #4, for a total value of $14,000. But, if we do the same as above, where we allow investments to shift in time, we can also accommodate investment #2, for a total value of $16,000 as shown here.
Don’t Just Prioritise, Optimise!
The ranking methods above generally fall in the category of prioritisation: they use simple rules to rank investments and select the best performing portfolio. Investment candidates #1, #2 and #3 in the table below summarize the results of the prioritisation ranking techniques used earlier.
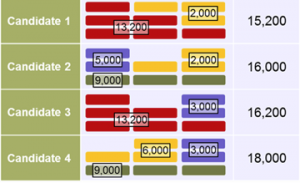
But there is another solution that honours all constraints AND delivers a higher value. The investments in portfolio candidate 4 deliver a value of $18,000 yet this portfolio doesn’t actually include the highest scoring individual investment (#1), and it doesn’t even use up all resources in the first year!
This sounds totally counter-intuitive, doesn’t it? I told you people found it harder than expected when we played the game using our Lego building blocks to optimally stack our investments! What it does illustrate is the need for advanced optimisation techniques to truly extract maximal value from a portfolio of investments.
In Summary
The most important thing to remember is that the objective is not to rank investments, but to optimise a portfolio of investments to realise the greatest value. And as you can see, optimisation is extremely complex and an iterative process. If we consider a relatively simple portfolio with:
- 100 investments
- 4 alternatives per investment
- 20 possible start dates
The number of possible combinations is 80100. This number is staggering and impossible to evaluate and/or manage manually, and this is where Asset Investment Planning & Management (AIPM) strategies—including optimisation—come into play.
I presented this challenge in Copenhagen in November and my colleague Boudewijn Neijens will be presenting it at the Iframi Asset Management Conference in Paris this week. I wonder how the French Asset Managers will cope with the challenge!
To learn more, check out our resources page.